
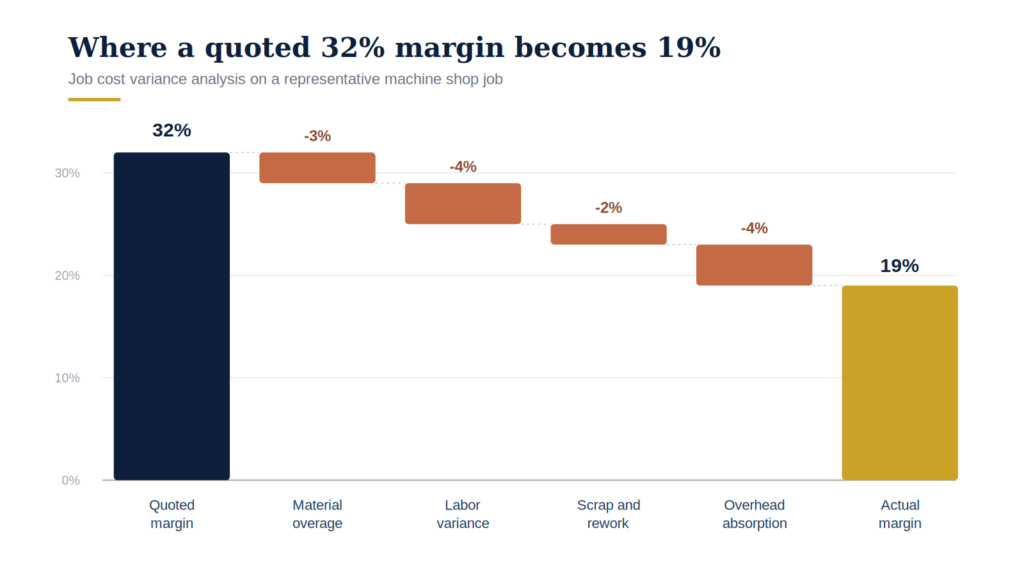
A shop floor supervisor pulls up a job that closed last week. It quoted at a healthy 32% margin — the kind of job that made the sales team happy and the estimator look good. But when the actual costs post, the margin comes in at 19%. Nothing on the job looked wrong. No single number jumps out. It just quietly ended up worse than planned, and nobody can point to exactly where.
This is the most common blind spot in manufacturing accounting: the P&L looks fine, the individual job costing report looks fine, and the margin still erodes. The only way to catch it is a proper job cost variance analysis — comparing what was estimated against what actually happened, category by category, instead of just estimate-vs-actual at the total job level.
Why the summary number hides the problem
Most shops already compare estimated cost to actual cost per job. But when that comparison stops at one number — “we came in $4,200 over” — it tells you the job lost money without telling you why. A $4,200 miss could be one bad material buy, or it could be four smaller problems stacking on top of each other. Those have completely different fixes, and a single variance number can’t tell them apart.
A job cost variance analysis breaks that one number into the categories that actually drive it: material, labor, scrap and rework, and overhead absorption. Once it’s broken apart, patterns show up that were invisible in the summary — the same operation running long on every job with a particular fixture, or a material category that’s been quietly repriced by a vendor without anyone updating the standard cost.
The four places margin actually leaks
On the machine shop job above, here’s how the 13 points of margin disappeared:
- Material overage (3 points). Actual usage ran ahead of the bill of materials — extra stock pulled for scrap allowance that was never dialed back in, or a price increase from a vendor that didn’t make it into the standard cost before the job was quoted.
- Labor variance (4 points). Actual hours exceeded the routing’s standard hours. Sometimes this is a real efficiency problem; often it’s a routing that was never updated after a process change, so every job on that part number is quoted against a standard that’s already wrong.
- Scrap and rework (2 points). Parts that didn’t pass inspection the first time. This category is usually undercounted because rework labor gets logged against the job’s regular labor code instead of a separate scrap/rework code — which is exactly why it doesn’t show up until you go looking.
- Overhead absorption (4 points). The job took longer than planned, so it absorbed overhead at actual hours instead of standard hours. This one is often the largest and the least visible, because it’s not a cost anyone “caused” — it’s a mechanical consequence of the other three variances.
Running a job cost variance analysis that actually catches it
The mechanics are straightforward, but they only work if the underlying data is trustworthy:
- Pull estimate and actual at the operation level, not just the job level. A job-level comparison averages away the specific operation or material line that’s driving the miss.
- Separate the four categories — material, labor, scrap/rework, overhead absorption — so a variance in one doesn’t get buried inside another.
- Check the standards before blaming the job. If the same variance shows up across many jobs on the same part number or the same operation, the routing or standard cost is wrong, not the job.
- Look at dollar-weighted variances, not just percentages. A 15% labor variance on a $400 job matters less than a 5% variance on a $40,000 job.
What to do with what you find
The point of this exercise isn’t a report — it’s a short list of specific corrections: a standard cost that needs updating, a routing that no longer reflects the actual process, a scrap code that isn’t being used consistently, or a quoting practice that isn’t building in enough cushion for a part family that’s historically run tight.
Run it quarterly on a sample of closed jobs, and the same two or three categories tend to show up every time. That repetition is the signal — it’s not noise, it’s where the business is actually losing margin, job after job, without anyone deciding to let it happen.
Robert Idzi, CMA, CSCA